 Goodreads makes the wonderful infographic above possible. I read 345 books in 2017, up from 323 last year.
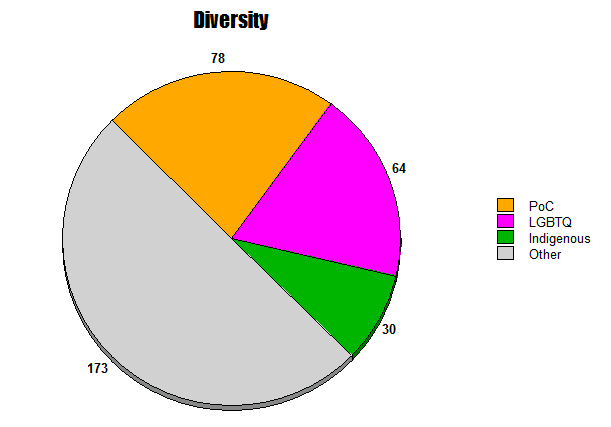
I like to examine my reading stats at the end of each year, to see how well I'm doing in my efforts to read as diversely as possible and to focus on reading books written by women. Looking at my statistics regarding format, genre and categories like poetry and nonfiction also help me know myself better as a reader. And so I made a whole bunch of pie charts. If you like pie, please grab a fork and scroll down. The numbers shown next to each piece of pie are the numbers of books that I read in that category.
Note: Add Edmonton authors to Canadian authors for the total from Canada: 137.
Other interesting stats: 25 titles read in translation and 4 books read in French language.
In making comparisons to 2015, the last time that I looked at stats this closely, I discovered:
- I'm reading about the same percentage of books by women (62% in 2017 vs 63% in 2015).
- I've increased the queer content in my reading (18% in 2017 vs 12% in 2015).
- I'm happy to have a big increase in reading more by Indigenous writers and People of Colour. Last time, I put these two groups together. (31% PoC + Indigenous in 2017 vs 17% in 2015.)
- I've also dramatically increased the number of Canadian books that I'm reading. (40% in 2017 vs 19% in 2015)


No comments:
Post a Comment